New housing data shows more people are buying existing homes, while more lenders are repossessing foreclosed homes.
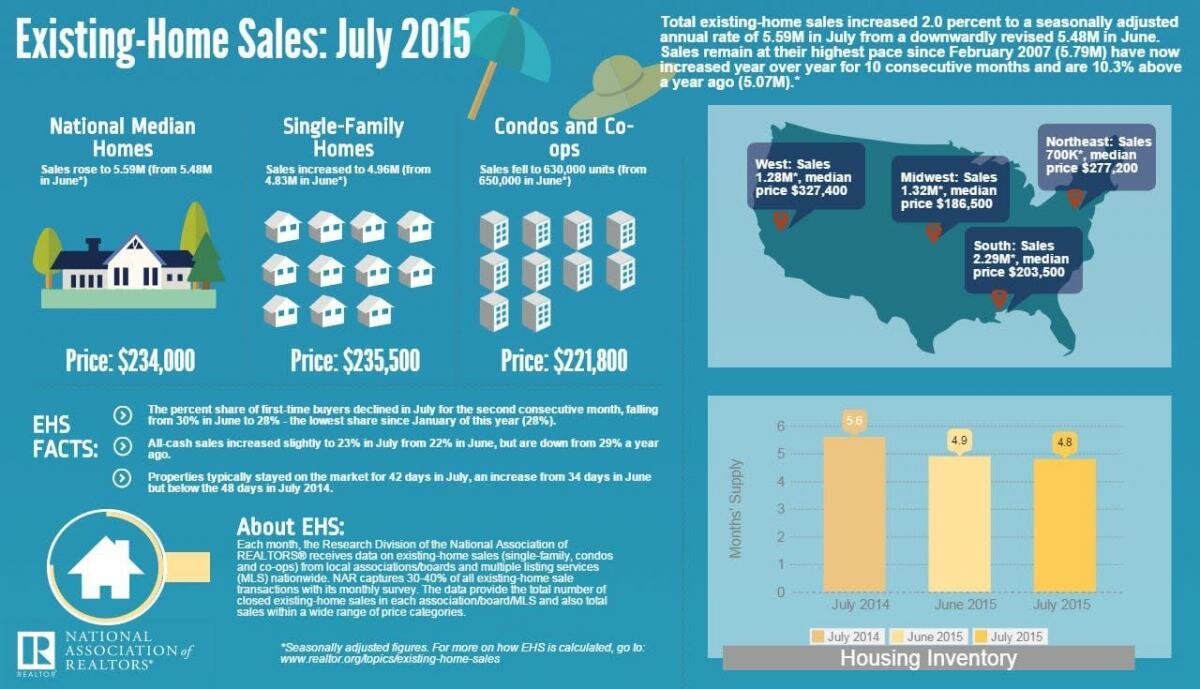
According to the National Association of Realtors (NAR), existing home sales rose by two percent to a seasonally adjusted annual rate of 5.59 million in July, from a downwardly revised 5.48 million in June. Overall sales activity in July meanwhile, stayed at the highest pace since February 2007 with 5.79 million sales, the tenth consecutive month that we’ve seen increased year-over-year sales.
The median existing home price for all housing types was $234,000, up 5.6 percent from one year ago, the NAR said. That represents the 41st consecutive month of increases in median existing home prices.
Unfortunately it’s not all good news. The total housing inventory declined by 0.4 percent to just 2.24 million homes currently listed for sale, which is 4.7 percent lower than the 2.35 million homes listed for sale a year ago. Unsold inventory currently accounts for a 4.8 month supply at the current sales pace, which is down from 4.9 months in June. Meanwhile, the percentage of first time buyers fell from 30 percent in June to just 28 percent in July.
“Despite the strong growth in sales since this spring, declining affordability could begin to slowly dampen demand,” NAR Chief Economist Lawrence Yun said in a statement. “Realtors in some markets reported slower foot traffic in July in part because of low inventory and concerns about the continued rise in home prices without commensurate income gains.”
There’s better news where it comes to foreclosures. The NAR said that distressed sales, which includes foreclosures and short sales, declined to seven percent in July from eight percent the month before. This represents the lowest share of distressed home sales since October 2008, when the NAR first began tracking the data.
However, the NAR’s data was slightly at odds with data from RealtyTrac’s July 2015 U.S. Foreclosure Market Report. According to that study, there were 124,910 foreclosure filings in process last month, a seven percent spike compared to the last month, and a 14 percent increase on the year before. Indeed, last July was the fifth consecutive month in which foreclosure activity increased, following 53 months of decreasing activity.
RealtyTrac also said bank repossessions were at a 30-month high, with 44 states seeing year-over-year increases. In total, lenders repossessed 46,957 homes across the nation last month – 29 percent more than the previous month, and a massive 81 percent more than in the same month last year.
Looking on the bright side, RealtyTrac said there were 45,381 new foreclosures (properties starting the process) last month, which is eight percent less than one month ago, and nine percent less than one year ago. Indeed, last month saw the lowest number of foreclosure starts since November 2014.
According to Daren Blomquist, Vice President of RealtyTrac, the decrease in new foreclosures is a case of lenders “flushing out old distress rather than new distress being pushed into the pipeline.”
Separate data from the HOPE NOW alliance shows that 411,000 homeowners of distressed properties found non-foreclosure solutions via mortgage servicers during Q2 of 2015. According to HOPE NOW, the figures suggest that for every foreclosure sale in the country, five other homes were saved by alternative solutions.
“Our data continues to show a consistent trend of non-foreclosure solutions outpacing completed foreclosure sales, which means that millions of families are receiving the help they need to avoid foreclosure,” Erik Selk, HOPE NOW’s executive director said in a statement. “The picture shows that more homeowners have been helped by the industry than have gone through a completed foreclosure. Completed foreclosures since 2007 are approximately 6.1 million compared to 24 million non-foreclosure solutions.”


