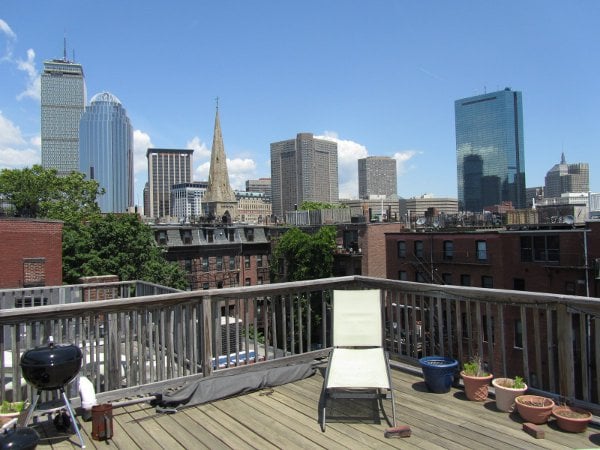
Boston’s real estate market is one of the fastest growing housing markets in the nation over the past decade. Median sales prices have consistently grown by near double-digit margins since 2015 thanks to a rapidly growing local population and a shortage of single-family homes. As a result, homes for sale in Boston tend to get snatched up quickly when they hit the market.
The median days on market for Boston real estate is 75 days over the past 12 months. That means the average sale in Boston from when the listing hits the market to when the closing occurs is around 2 and a half months. That is more than 20 days longer than the national median days on market, which is 53.5 days during the same time span.
If we analyze that same figure by neighborhood, we can see where homes stay on the market longest in Boston compared to others. Properties tend to sell very quickly in Cambridge (61 days), Medford (61 days), and Roslindale (62 days) compared to other areas. There are 11 neighborhoods where the median days on market is below 70 days:
| Neighborhood | Median Days On Market |
| Brighton | 69 |
| Charlestown | 69 |
| Hyde Park | 68 |
| Mission Hill | 67 |
| Jamaica Plain | 65 |
| Somerville | 64 |
| West Roxbury | 64 |
| Quincy | 64 |
| Roslindale | 62 |
| Medford | 61 |
| Cambridge | 61 |
In terms of longest median days on market, Fort Hill tops the chart at 151 days on market. It’s important to note that Fort Hill does not record a large number of real estate transactions. There have been only 42 residential properties sold in Fort Hill over the last 12 months, and there are only 6 currently active homes for sale in Fort Hill. With such limited sales numbers, it’s easy for the median to be skewed if a small number of properties took a long time to sell.
Downtown, East Boston, and Seaport also see longer real estate sales cycles than other neighborhoods at 110, 110, and 104 median days on market respectively. There are 8 neighborhoods total in Boston where the median days on market is over 90:
| Neighborhood | Median Days On Market |
| Fort Hill | 151 |
| Downtown | 111 |
| East Boston | 110 |
| Seaport | 104 |
| Chinatown | 101 |
| West End | 93 |
| Longwood | 93 |
| North End | 93 |
Interestingly, with the exception of Fort Hill, most of these areas are located in Boston’s inner core close to Downtown and have much higher median sales prices than most areas in Boston.
Despite the competitive housing market, Boston’s median days on market is not as short as some would expect. It may be due to higher than average list prices in Boston as a result of seller confidence. Either way, these longer sales cycles provide leeway for home buyers to negotiate lower prices than what is listed for sale.


