Real Estate Marketing & Beyond

© iQoncept - Fotolia.com
I was reading a very interesting article on one of my favorite research blogs, when I noticed a striking correlation between employment and housing prices that would seem to indicate that the housing market has "recovered" and has in fact, reached a fundamental peak in home values. However, as Bill Clinton might say, "this depends on your definition of "recovery"."
The Chart below is produced by the St.Louis Federal Reserve. This particular chart simply shows what percentage of the civilian population was employed at any given time since world war II ended. You'll notice that in 2012, approximately 58.8% of the civilian population is currently employed. You may also clearly see that this ratio is more or less moving sideways, not making any substantial progress since 2009.
As you can also see from this chart, the last time we were down to 58.8 percent employment of the civilian population was 1983. When you view the chart for the period from 1983 to 2012, you can see something of a rough parallel with growth of the housing bubble.
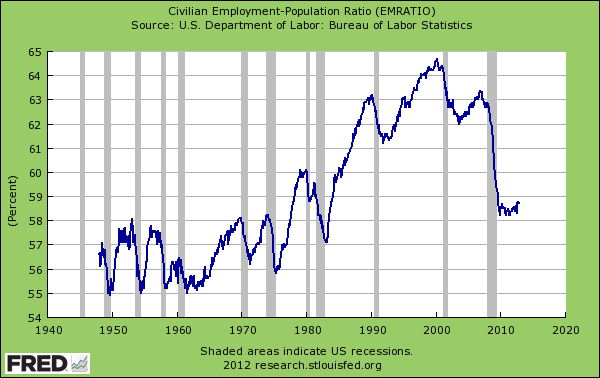
Current percentage of employed civilians today lowest since 1983.
When I noticed this seemingly coincidental parallel, I checked on the history of home values, as defined by data compiled by Robert Shiller, in his study of the history of home values over time. I wanted to compare current home values, with those in 1983, and see if there happened to be any correlation with the civilian employment activity.
Below is the chart I found, courtesy of pricedingold.com, that most clearly shows a correlation between the percentage of the civilian population that is employed, and historical home values.
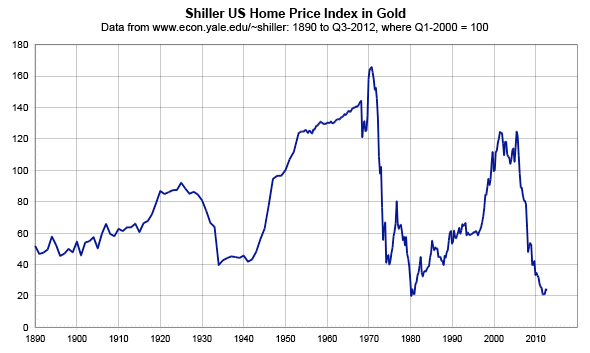
Long Term Home Price Data - Case-Schiller
The two bottom points on the Shiller chart are also 1983 and 2012, which essentially implies that home values move roughly in tandem with trends in civilian employment. The more civilians in the work force, the more folks there are that can afford to buy a home. We all know that the declining fortunes of the housing market these past few years have been largely the result of the steep reduction in civilian employment since the recession started in 2007.
If we assume the general accuracy of both sets of data, it follows that the housing market actually has already recovered, to the extent that it CAN recover. In short, if civilian employment does not move significantly higher, then home prices cannot move higher. This is merely a display of the classic market fundamental of supply and demand. Employment creates demand, which then leads to tighter inventory and rising prices.
We have seen slight increases in home prices over the past year, and some reports of inventory tightening. Much of this activity has been driven by wall street funded investment companies who have been buying up hundreds of millions of dollars worth of foreclosures over the past year. Civilian employment has remained flat, as the first chart indicates, thus real demand from end user buyers is simply not increasing that much, in spite of Ben Bernanke's efforts to force interest rates to historical lows.
In a nutshell, these two charts show that housing market activity is essentially at it's peak, because civilian employment is moving sideways, not growing. In fact, there is very recent data that indicates that the current level of home prices may be as good as it gets for years to come, because the employment rate is not really improving. Millions of unemployed folks are now leaving the workforce. When you stop looking for work, the government no longer classifies you as being unemployed.
So the fact that home values seem to be improving is not proof that housing is about to take off on a new recovery that will return us to the values we took for granted in 2005. Far from it. There are other data that show that we are probably lucky that home prices are even rising at all.
Today, some 47.7 million folks are on food stamps. Over 1 million new food stamp recipients were recently added in just two months time! Indeed we've seen the food stamp program growing exponentially over the past few years to unprecedented levels. And the Obama Administration actually believes that putting folks on food stamps stimulates our economy.
Between the data shown in the above charts, combined with the mystifying belief that spending on food stamps is an "investment" in job creation, it's probably safe to say that the current housing market "recovery" will be as good as it gets for the foreseeable future.
Donna S. Robinson is a real estate investor, author and residential market analyst located in Atlanta, GA. Follow her on twitter at donnaconsults. Her latest book, Basics Of Real Estate Investing is now available on Amazon.