Real Estate Marketing & Beyond
Mortgage rates comparison website HSH.com has just published a new analysis showing the required annual salary needed to afford a median priced home in the nation’s top 50 metro areas.

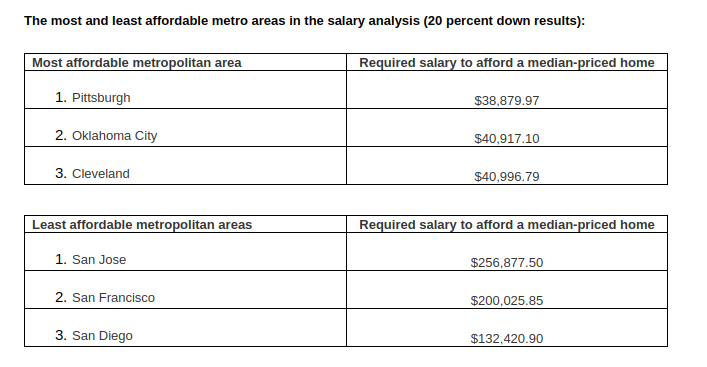
There’s good news for anyone living in Pittsburgh, Oklahoma City and Cleveland, which were rated as the top three cheapest metro areas for those looking to buy a home. But those who live in San Jose, San Francisco and San Diego might be in for a shock, with only the highest-bracket earners likely to be able to afford a home of their own.
HSH’s analysis combines the National Association of Realtor’s latest quarterly home price data with local property tax and homeowner’s insurance data, then calculates the income needed to buy a median priced home in each respective market. The report provides calculations for both a 10 percent and a 20 percent down payment.
One of the main takeaways from the report is that overall, home affordability is still an issue in most of the U.S.’s top metro areas, as accelerating home prices and mortgage rates mean the minimum income required to buy a home continues to rise.
Here’s the top three most and least affordable metro areas and the minimum salary required to buy a home there:
HSH’s report notes some interesting if somewhat obvious trends, the main one being that home prices continue to rise across the nation. Meanwhile affordability continues to decline, even though mortgage rates have only risen slightly in the last quarter. What with the affordability issue growing, it’s little surprise that existing home sales have been in decline this year, HSH said.
Still, there are some indications that home prices could be nearing their peak. During the third quarter, quite a few metro areas saw quarter-to-quarter declines in the median price of homes sold. For example, in 2018, 29 metro areas posted a Q-to-Q decline; in 2017, 28 markets did, and there were 26 such comparisons back in 2016. For markets that did show a Q-to-Q decline, the median decline was 2.05%; in 2017, it was 1.53%, and in 2016, just 0.90%. As such, not only are more metro areas seeing this quarterly shift, but the amount of the reduction seems to be growing.
Home sales are also slowing down, and that should help to balance the limited inventories better against demand, though it may take a while.
“Aspiring middle-class home buyers continue to face affordably issues, as buyers are increasingly being priced out in the West while the rest of the country struggles, too,” NAR chief economist Lawrence Yun said recently.
All in all, housing markets remain competitive and that’s bad news for those on low to moderate incomes.