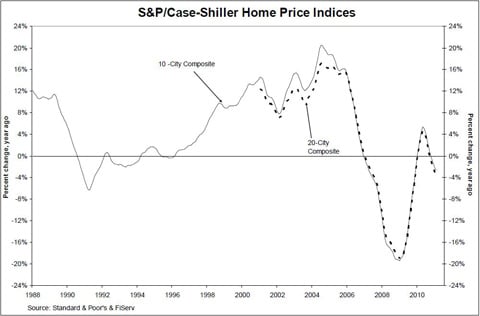
Single family property prices in the US have dropped into what’s known as ‘double-dip’ territory according to the latest figures available for March, as weak demand and a large inventory continue to bog down the markets, a new survey has shown.

The Case/Shiller Index for March shows a double-dip in property prices. Courtesy of Forbes
The S&P/Case Shiller index, which lists property sales in the 20 biggest metropolitan areas in the US, dropped by 0.2% last March, just as economists had predicted. The new data reveals that the average price of US homes have reached their lowest level yet since all our troubles began back in 2006.
“The data confirms a double-dip in property prices throughout the country,” said the index committee chairman David Blitzer. “There is no relief in sight as property prices continue to plummet like a stone.”
The index showed that home prices fell from the end of February until the end of March in 18 out of 20 metropolitan areas. Worse still was that values in 12 of the biggest real estate markets dropped to their lowest since 2006.
The only metro areas to show an increase where in Washington DC and Seattle.
US home prices are at their lowest since 2006 in 12 of the largest US cities. Courtesy of MBNC
This latest drop is the eight month in succession that property prices across the US have fallen.
The dozen cities that are now at their lowest point are: Miami, Las Vegas, New York, Chicago, Tampa, Atlanta, Phoenix, Charlotte, Minneapolis, Detroit, Cleveland, Portland, Oregon.
What’s immediately noticeable is that the worst property price declines seem to take place in the areas that have been hardest hit by foreclosures and unemployment, such as Detroit, Phoenix and Las Vegas.
Case-Shiller Index, March 2011
| Metro area | One-month change (March/Feb) | One-year change |
| Atlanta | -1.9% | -5.2% |
| Boston | -1.7% | -2.7% |
| Charlotte | -2.4% | -6.8% |
| Chicago | -2.4% | -7.6% |
| Cleveland | -1.8% | -6.3% |
| Dallas | -0.8% | -2.5% |
| Denver | -0.6% | -3.8% |
| Detroit | 2.0% | -0.9% |
| Las Vegas | -1.1% | -5.3% |
| Los Angeles | -0.3% | -1.7% |
| Miami | -0.8% | -6.1% |
| Minneapolis | -3.7% | -10.0% |
| New York | -0.9% | -3.4% |
| Phoenix | -0.5% | -8.4% |
| Portland | -0.7% | -7.6% |
| San Diego | -0.8% | -4.0% |
| San Francisco | -0.1% | -5.1% |
| Seattle | -0.1% | -7.5% |
| Tampa | -0.7% | -6.9% |
| Washington | -1.1% | 4.3% |
| 20-city composite | -0.8% | -3.6% |